
12-Month Market Forecast
See where UK auction prices could head next — then drill into any bottle. Rankings below use the same model as your personal forecast.
Strongest model outlook — if you invested today
Top auction-market movers by horizon. Tap a bottle to run your own forecast.
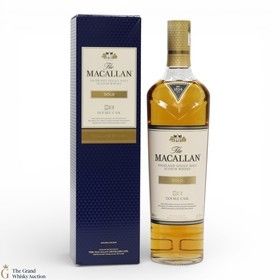 +7.9%
 +9.2%
 +2.8%
 +2.7%
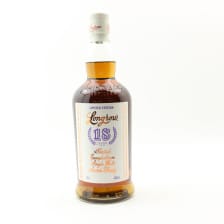 -1.9%
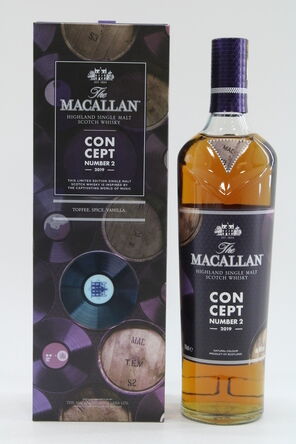 -5.5%
 -7.2%
 -5.9%
 -7.3%
 -12.4%
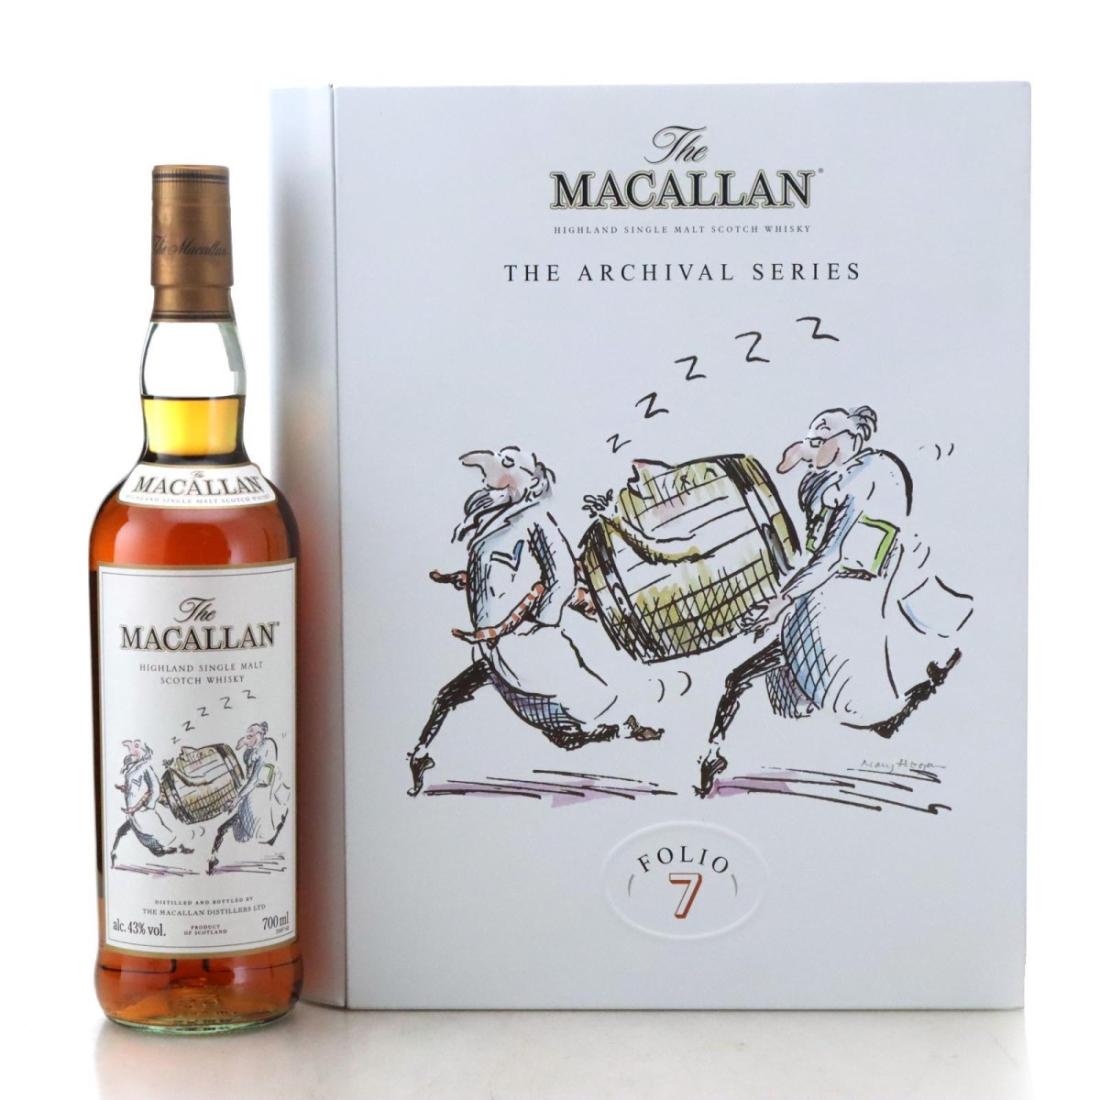 -15.5%
Illustrative model output from UK auction hammer history — not financial advice. Longer horizons are less certain; ranges widen on individual forecasts. Updated 8 Nov 2026, 15:00 UTC
Predict Future Whisky Prices
Search for a whisky to see a blurred prediction preview — sign in for saved history, or upgrade to Premium+ for unobscured figures.
Analyzing historical data and generating predictions...
Whisky Name
12-Month Price Prediction
Prediction Confidence
Price Scenarios
Price Trend Analysis
Market Analysis
Important Disclaimer
I am not a professional financial advisor or investment expert. All price predictions and market rankings are statistical estimates from UK auction hammer history and should not be considered as professional financial advice. Please do your own research and consult with qualified professionals before making any investment decisions. I take no responsibility for any financial losses or decisions made based on the information provided by this platform.